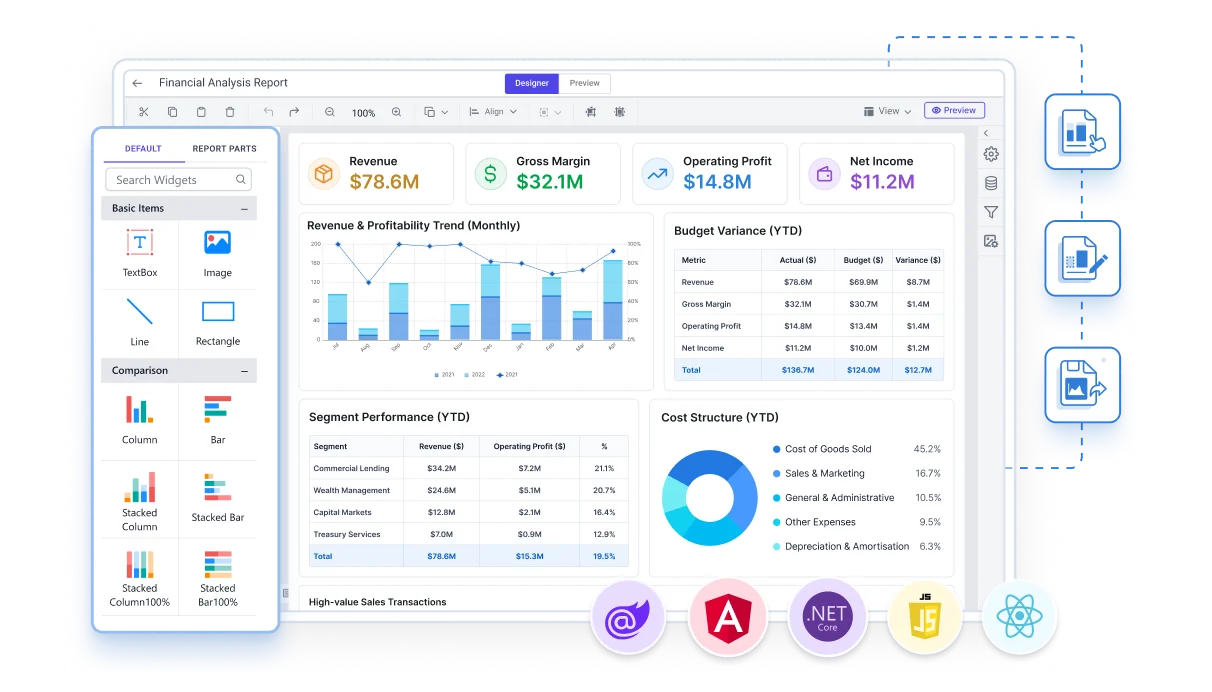








Build pixel-perfect RDL reports without leaving your application
A web-based, drag-and-drop report designer that lets business users and developers create and edit SSRS RDL and RDLC reports directly inside your product, no separate design tool required.
No credit card required.
J&J
Schneider
Bridgestone
Siemens
Verizon
HP
Fidelity
Intel
Everything a modern report designer should do
Every Bold Reports designer shares the same capabilities, so the design experience stays consistent whether it's embedded in a React or Angular SPA, a Blazor or ASP.NET Core app, or a traditional ASP.NET MVC/Web Forms application.
What report authors touch
Business users and developers drag report items onto a design surface, connect data, and preview the layout, the design-time counterpart to the runtime viewer.
Standalone or server-connected
Run the designer against locally stored reports, or connect it to Bold Report Server or SSRS to share data sources, publish reports, and manage versions.
Design Reports Natively in Your Stack
Drop the designer component into your existing codebase and point it at a data source, with no separate design tool and no rebuild of your application.
Everything needed to design a report
The same design surface, data tools, and expression engine, whether the designer is embedded in your app or opened as a standalone tool.
Connect to any data source
Connect to a wide range of data providers, hosted locally or on a server. Built-in data sources (SQL Server, SQL Azure, XML, Oracle, OLEDB, ODBC), business objects (IList, DataSet, DataTable), web-based sources (Web API, JSON, OData), and custom connectors (MySQL, SQLite, PostgreSQL, MongoDB).
Visual query builder
Build queries in a few clicks with a drag-and-drop query builder that helps both technical and non-technical users create and view relationships between tables, without writing SQL by hand.
Rich report items & data visualization
Text box, image, line, rectangle, table, matrix (pivot table), and list, plus data visualization with charts, sparklines, data bars, gauges, indicators, and maps, and custom items like barcodes, QR barcodes, and e-signature.
Interactive reports
Build reports with drill-down, drill-through, hyperlinks, bookmarks, document maps, subreports, and nested data regions, so end users can explore report detail at runtime.
A Platform, Not Just a Rendering Engine
Everything You Need to Design, Deliver, and Scale Reporting
From report authoring and delivery to embedding and multi-tenant deployment, Bold Reports provides the capabilities needed to support enterprise reporting at every stage.
Professional Report Designer
Create print-ready reports with precise pagination, layout control, and print fidelity.
Native RDL
Open and edit existing SSRS report files while preserving report definitions.
Interactive Report Viewer
Search, filter, sort, drill down and drill through in a responsive web viewer.
Report Scheduling
Recurring generation and delivery to users, groups, and distribution lists.
Embedded Reporting SDKs
SDKs for .NET, JavaScript, Angular, React, Blazor, and WPF application development.
Multi-Tenant Architecture
One deployment serving multiple customers or business units with isolated data and branding.
Use Cases
What you can do with the report designer
The same design surface adapts to a range of reporting scenarios, from letting end users build their own reports to standardizing report creation across a team.
Let end users build their own reports
Give customers or internal teams a self-service way to design the exact report they need, instead of filing a request with IT.
Standardize invoice and statement layouts
Design reusable, pixel-perfect invoice, receipt, and statement templates that render identically on screen and in exported documents.
Centralize report creation across teams
Give report authors one design tool with shared data sources, so sales, finance, and operations reports stay consistent.
Migrate existing SSRS report definitions
Open existing RDL report layouts directly in the designer and continue editing them, without recreating reports from scratch.
Build multi-tenant report templates
Design parameterized report templates once and reuse them across multiple clients or business units with different data scopes.
Give non-developers a browser-based way to design reports
No local install, no Visual Studio project and business users design pixel-perfect reports directly in the browser, using the same drag-and-drop surface your developers use to embed reporting in your app.

Report Designer is one part of the embedded reporting toolkit
Four embedded reporting tools that work together to design, view, manage, and deliver reports from a single platform.
Report Designer
Create and edit reports, datasets, and data sources directly inside your web application with an intuitive designer.
Report Viewer
Render and display RDL/RDLC reports natively inside your application, with full interactivity, drill-down, drill-through, parameters, and export.
Report Writer
Export RDL/RDLC reports to PDF, Excel, CSV, PowerPoint, Word, and HTML from Designer, Viewer, or Server.
Enterprise-Ready Compliance
Bold Reports helps you meet key security and compliance standards. All activity logs are safely stored, can’t be changed, and are easy to export when needed.
Enterprise-Ready Compliance
Bold Reports helps you meet key security and compliance standards. All activity logs are safely stored, can’t be changed, and are easy to export when needed.
Get the Details You Need
Frequently Asked Questions
A report designer is a tool for creating and editing report layouts, most often Microsoft SSRS RDL or RDLC files, using a drag-and-drop design surface, data connections, and expressions, before the finished report is opened at runtime in a viewer.
The designer is what business users and developers use to build and edit a report's layout, data, and parameters. The viewer is what end users interact with afterward to open, explore, and export the finished report.
JavaScript, Angular, React, Blazor, ASP.NET Core, ASP.NET MVC, and ASP.NET Web Forms, each with a native component, plus a standalone designer application.
Built-in support for Microsoft SQL Server, SQL Azure, Oracle, OLEDB, ODBC, Web API, OData, JSON, and XML, plus business objects like IList, DataSet, and DataTable, and custom data processing extensions for sources such as MySQL, SQLite, and PostgreSQL.
Text boxes, images, lines, rectangles, tables, lists, matrices (pivot tables), more than 20 chart types, sub-reports, barcodes, and other report items, the same visual vocabulary rendered later in the report viewer.
It runs smoothly on all modern browsers, including Chrome, Edge, Firefox, and Safari, using pure HTML5 for consistent performance across environments.
Yes. The designer supports drill-down, drill-through, bookmarks, document maps, and nested data regions, so you can build reports that let end users explore detail without leaving the report.
Yes, through a built-in expression editor that supports constants, built-in fields, parameters, datasets, variables, operators, and common functions, along with sorting, filtering, grouping, and calculated fields for shaping data.
No. Reports are built with drag-and-drop report items and a visual query builder, so both technical and non-technical users can design paginated reports without writing code.
Reports can be saved to Bold Report Server in the Microsoft RDL standard, or downloaded to your computer, so authorized users can access and view them once published.
Yes, Bold Reports is free to try for 30 days, no credit card required.
Ready to let your users design their own reports?
Embed a report designer that feels like a native part of your application, fully branded and easy to use.
No credit card required.