
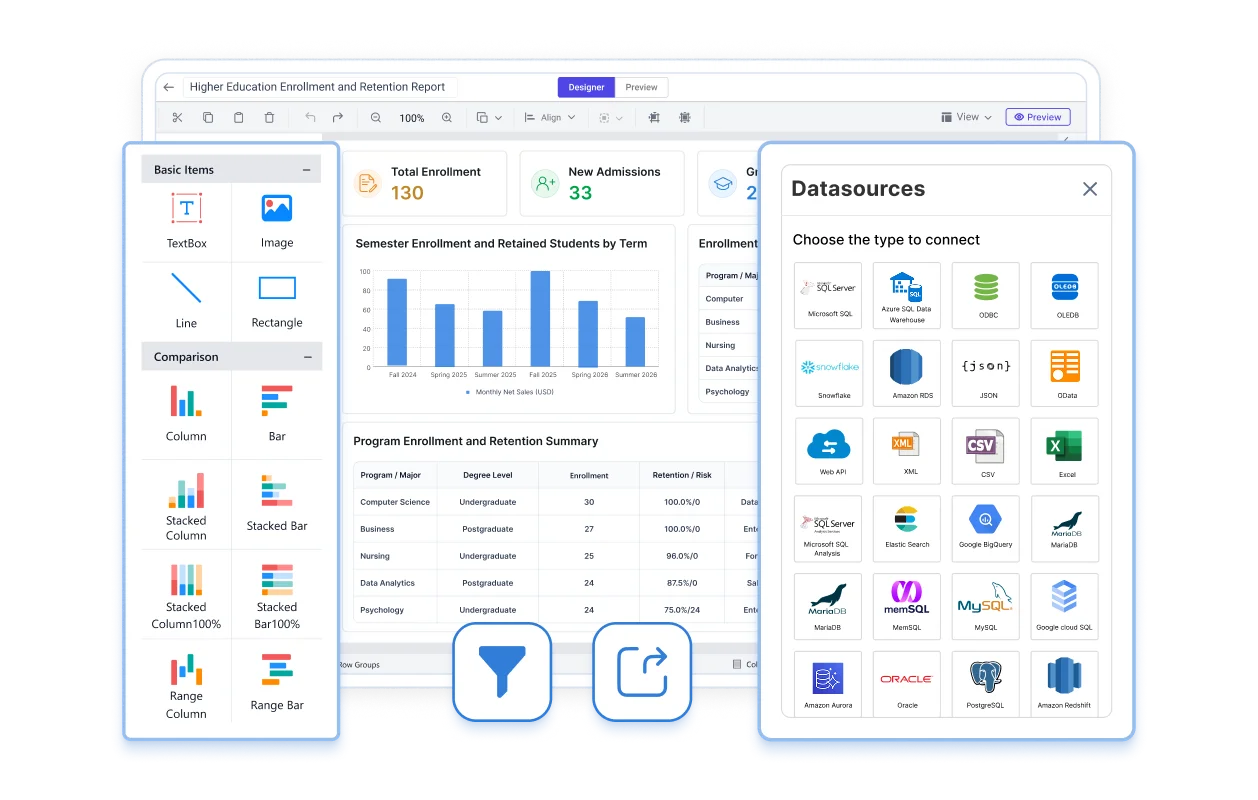







Desktop-based tool

No browser or cloud dependency

Deploy anywhere

Push reports to any environment

No server lock-in

Design fully offline, on your desktop

All features included

Full toolset, right from installation

Trusted by leading companies

J&J

Schneider

Bridgestone

Siemens

Verizon

HP

Fidelity

Intel

Core Capabilities

Everything you need to build RDL/RDLC reports

A complete set of tools built into this standalone report designer covering everything from first connection to final output.

connect-any-data-source
Connect to any data source

SQL, Azure, Oracle, MySQL, PostgreSQL, Web API, JSON, XML, SSAS built in, with no custom code.

pixel-perfect-report-design
Pixel-perfect by design

Parameters, hyperlinks, and drill-downs reports that look exactly the way you designed them, every time.

interactive-report-visualization
See your data, not just your tables

Charts, gauges, maps, and KPIs turn raw data into something people actually understand at a glance.

flexible-report-deployment
Deploy anywhere, lock into nothing

Save as RDL locally, or deploy straight to Bold Report Server or Microsoft SSRS. Your call.

Why switch

Everything you liked about SSRS and Crystal Reports none of the server

Feature SSRS Report Builder Crystal Reports Bold Standalone Designer
Cost Requires SQL Server license Paid · EOL Dec 2026 Free 30-day trial
Server required Yes No, but desktop-bound No
RDL/RDLC compatible Native No 100% compatible
Modern data sources Limited Limited SQL, Azure, Oracle, MySQL, PostgreSQL, Web API, JSON, XML, SSAS

Make the switch without the migration headache

Import your existing RDL/RDLC files and start editing immediately no rebuild, no data loss, no learning curve.

Reporting Made Simple

Built-in features for easy report creation

Design, customize, and preview RDL/RDLC reports with an intuitive interface that covers every step from connecting data to sharing the final output.

user-centric-report-designer

User-centric interface

Design RDL and RDLC reports visually with a WYSIWYG canvas, gridlines, and snap-to-grid alignment built for anyone building reports without writing layout code.

interactive-report-elements

Interactive report elements

Add tables, charts, maps, images, subreports, barcodes, and QR codes to turn static reports into dashboards your audience can explore.

runtime-report-parameters

Runtime report parameters

Let end users filter and customize report output on the fly by passing input values at runtime fully supported across RDL and RDLC.

visual-sql-query-builder

Visual SQL query builder

Build complex data queries and define table relationships through a drag-and-drop query designer no SQL scripting or database expertise required.

no-code-expression-editor

No-code expression editor

Control formatting, calculations, and conditional visibility with a built-in expression editor code-level customization without needing to code.

live-report-preview

Live report preview

Catch layout, data, and formatting issues before you export, with a live preview that updates as you design cutting rework and last-minute fixes.

multi-format-report-export

Multi-format report export

Export finished reports to PDF, Excel, Word, CSV, and HTML in just a single click, so every stakeholder always gets the exact format they actually need.

page-formatting-controls

Page formatting controls

Fine-tune paper size, margins, orientation, and measurement units directly in the designer, so every report is print-ready without extra layout work.

For Every Role

One Designer. Every Role Gets What They Need.

Business analysts, IT teams, and developers all work from the same designer, each using the parts built for their job.

  • Business Analysts Build and customize reports without waiting on IT. Drag-and-drop widgets turn raw data into decisions.
  • IT Teams Deploy inside your own infrastructure, manage access, and keep everything compliant, with no external server dependency.
  • Developers Extend the platform with custom APIs, embed reporting natively into your app, and ship updates without vendor lock-in.

Frequently Asked Questions

Answers to the questions we hear most before teams download the designer.

No: unlimited reports, no credit card, no time limit. It’s a desktop tool for designing RDL/RDLC reports at no cost.

No. The drag-and-drop canvas, visual query builder, and expression editor cover formatting, calculations, and data binding without writing code.
Windows desktop. No web server or browser dependency is required to design or preview reports.
It’s designed as a drop-in RDL/RDLC designer, 100% compatible with existing SSRS reports, so most teams migrate without rebuilding anything.

Yes. The designer opens RDL files created in SSRS Report Builder directly, so you can edit and preview them offline before redeploying to your SSRS server.

SQL Server, Azure SQL, Oracle, MySQL, PostgreSQL, Web API, JSON, XML, and SSAS, among others, all built in without custom code.
RDL reports are designed for server-based deployment (SSRS or Bold Report Server); RDLC reports are compiled and rendered directly inside an application. The Standalone Report Designer includes separate launchers for designing each type.

Text boxes, images, tables, lists, matrices, charts, gauges, maps, subreports, and items like barcodes and QR codes are all supported on the design surface.

Save reports locally as RDL, or deploy directly to Bold Report Server or Microsoft SSRS on your own infrastructure.

No. Designing and previewing reports happens entirely offline on your desktop. An internet connection is only needed if you choose to deploy to a remote server.

Ready to Build Your First Report?

Build pixel-perfect RDL/RDLC reports on your desktop, on your terms. No server setup, no migration required, just open your files and start designing.

No credit card required · 30-day free trial · Windows desktop